To get the most out of your expert advisor, you'll need to optimize and backtest your strategy using MetaTrader's Strategy Tester. While forward testing on a demo account is essential, backtesting allows you to simulate trading over a long period of time in just minutes. And with the optimization feature, you can find out which settings performed best over a selected historical chart period.
There is considerable debate over the accuracy of MetaTrader's strategy tester. At best, backtesting offers only a close approximation of how trades would be executed in real-time. But it's the only tool available to rapidly test any strategy over a wide range of trading situations, and one that you should learn how to use well.
Open the Strategy Tester in MetaTrader by clicking the appropriate button on the toolbar or by selecting Strategy Tester from the View menu.
Before backtesting or optimizing, it's important to make sure that your history data is complete and accurate, especially if you're using 'Every tick' as your testing model. If you see 'mismatched chart' errors in your Journal log or if your modeling quality is less than 90%, your history data is insufficient to generate accurate ticks.
Open the History Center from the Tools menu or by pressing F2 on your keyboard. Double click the chart pair in the left column that you plan to backtest for. A list of time periods will appear below. Start by double clicking on 1 Minute (M1) to load the history data for that period. The backtester uses M1 data to generate ticks, so it is important that your M1 data is complete.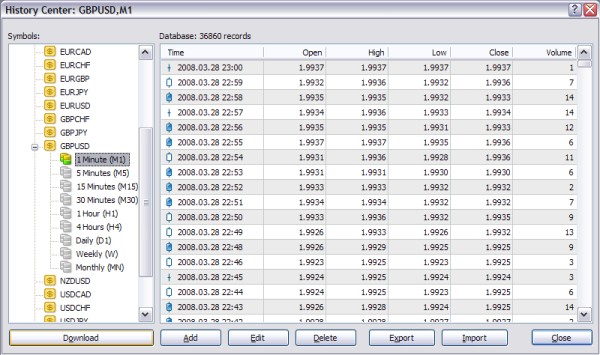
From the History Center, you can download or import data to use in backtesting. Your broker will automatically provide some recent data, but it may not be enough for a longer backtest. In addition, the free downloadable data from MetaTrader (accessible via the Download button) is not always complete, and can contain large gaps.
You can download free M1 data from http://www.forextester.com/data/datasources.html. First, select the M1 period for the symbol from the list on the left-hand side. Click the Import button, and then click Browse in the Import dialog to select the M1 data file you just downloaded. Press OK to import the data -- it may take several minutes. You now have several years of M1 data for that symbol.
To make use of this data on higher timeframes, you'll need to use the period_converter script that comes with MetaTrader. Open a chart window and set it to M1. Drag and drop the period_converter script from the Navigator window onto the chart, and set the ExtPeriodMultiplier setting to the number of minutes to convert to. For M15, use 15; for H1, use 60; for H4, use 240, and so on.
Repeat this process for all of the symbols/periods you plan to test on. Once you have sufficient history data, you can begin testing. The video below demonstrates the process of importing and converting the M1 data:
The optimization feature of MetaTrader 4 allows you to test thousands of combinations of expert advisor settings to find the most profitable settings for the selected chart, period and date range. Indicator-based strategies will need to be optimized for maximum profitability. However, almost all EAs will benefit from optimization - even those that trade on tick data, provided you have complete M1 history data (see above).
While the optimizer will return the most profitable settings for the selected date range, this is no guarantee that these settings will be profitable in the future. Market conditions change often, so it is important to regularly re-optimize your expert advisor for best results.
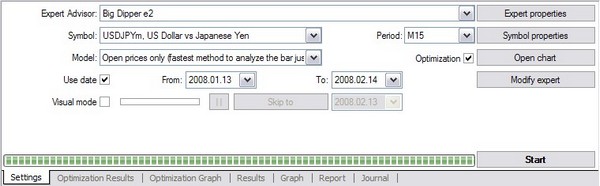
To optimize your expert advisor, first select it from the Expert Advisor drop-down box. Select the currency pair from the Symbol box and chart period from the Period box. For Model, you'll generally want to select "Open Prices Only," unless you are optimizing an EA that runs on tick data. In that case, select "Every Tick." Check the Use Date option and select a range of dates to optimize for. Lastly, make sure that Optimization is checked.
Click the Expert Properties button to open your expert advisor settings. Under the Inputs tab is where you'll enter the range of values to optimize for. The Start column will be the lowest value for a given setting, while the Stop column will be the highest. The Step column is the amount that the optimizer will "step through" from the Start to the Stop setting.
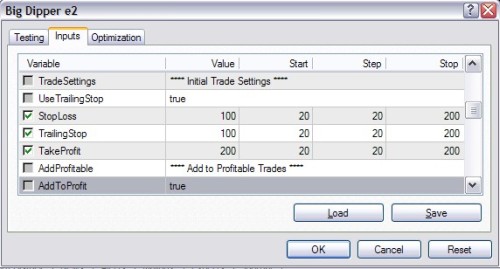
In the image above we are optimizing SL, TS and TP settings for an expert advisor. The Start value is 20, the Step is 20, and the Stop is 200. The optimizer will test every combination of values from 20, 40, 60 and so on up to 200. Use a start, step and stop value that is appropriate for the setting you are optimizing. Even values (5, 10, etc.) are good.
The checkbox to the far left must be selected for that setting to be optimized. Any settings that aren't checked will use the number in the Value column when optimizing. Under the Testing tab, you can adjust the Initial Deposit to something a bit more realistic. Leave the other settings at their defaults.
When you're ready to begin optimizing, hit the Start button at the bottom right of the Strategy Tester window. Depending on the period, the date range, the testing model and the number of settings to be optimized it can take anywhere from a few minutes to several hours. If it's taking too long, consider shortening the date range, optimizing fewer settings, or using a larger step value.
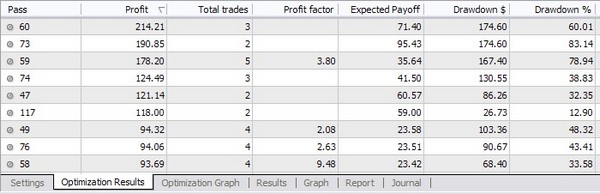
Once the optimization is finished, open the Optimization Results tab and double-click the Profit column to sort the results. Double-click any of the results to load it into the tester. Hit the Start button again to backtest with the selected settings.
By now, it should be obvious how the backtester works. Select your Expert Advisor, Symbol, Period and Model, check the Use Date box and select a date range. Select Visual Mode only if you want a visual walkthrough of the backtesting. Leave Optimization unchecked.
Hit the Expert Properties button and enter your settings in the Value column under the Inputs tab. You can also load or save settings using the buttons in the bottom right. The Start, Step and Stop columns are ignored, as are the checkboxes.
Close the Expert Properties dialog and press Start to begin testing. It will take anywhere from a few seconds to several minutes depending on your settings. Once testing has finished, open the Report tab on the bottom to see your results.
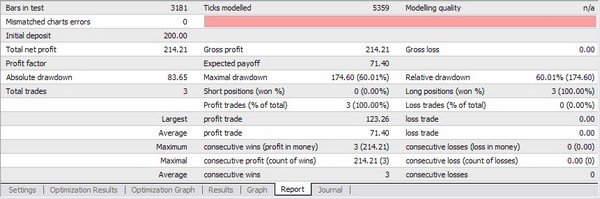
A few statistics to take note of:
The Results tab at the bottom of the strategy tester will give you the details on opened and closed orders, including trailing stop, take profit and stop loss. Click the Open Chart button to get a visual representation of your results. When testing your new EA, examine these closely to ensure that your strategy is working as intended.
While backtesting and optimization can give you a good idea of how your EA will trade, you will need to do more extensive testing to ensure that your trading system is truly profitable. The best way to achieve this is by a process called walk-forward analysis.
Walk forward analysis simply consists of multiple cycles of optimization and backtesting, and analysing the results of testing over a long period. Our article on walk forward analysis explains the process in more detail. Our Walk Forward Analyzer for MetaTrader allows you to perform WFA quickly and easily.